React Native Style Libraries Benchmark
Original reproducer was created by @tj-mc: https://github.com/tj-mc/styled-components-native-perf-reproducer
This is an Expo SDK 49 App reproducer to demonstrate the performance difference between using popular style libraries and react-native built-in styling.
Tests include React Native StyleSheet, Styled Components, Tamagui, NativeWind, Emotion and Shopify restyle
Feel free to fork or PR this repo with improvements or to include other styling libraries.
Note: Test scores may vary between different machines with different hardware
Note: Tamagui scores are surprisingly low, I’ve created a discussion about it
1000 items are rendered in Array.map to simulate the complexity of a real app.
Read this comment on how to test the performance: styled-components/styled-components#3940 (comment)
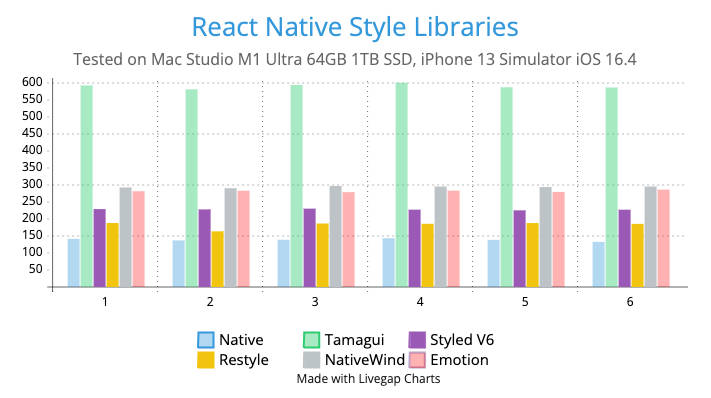
Results – Rendering Time for 1000 Empty Views (ms)
Mac Specs: Mac Studio M1 Ultra 1TB SSD 64GB RAM Simulator: iPhone 13, iOS 16.4


| 1 | 2 | 3 | 4 | 5 | 6 | Avg | % Slowdown | |
|---|---|---|---|---|---|---|---|---|
| Native | 140.1 | 135.6 | 137.5 | 142.1 | 137.2 | 131.3 | 137.6 | 0 |
| Tamagui | 591.4 | 579.8 | 592.8 | 599.3 | 586 | 585.8 | 588.2 | 327.3% |
| Styled v6 | 227.7 | 226.7 | 229 | 226 | 224 | 225.9 | 226.7 | 64.86% |
| Restyle | 186.8 | 162.3 | 185.2 | 184.4 | 186.6 | 184.2 | 182.5 | 32.63% |
| NativeWind | 291.3 | 289 | 295.6 | 293.9 | 292.6 | 294 | 292.9 | 112.3% |
| Emotion | 280.1 | 281.7 | 277.5 | 282 | 278.2 | 285 | 280.9 | 104.8% |
Reproduction Steps
- Start the profiler by pressing Shift + M and open React Dev Tools.
- Open profiler and hit record
- Press the toggle button and stop recording
- Record the time to render App.ts
- Average the result across at least 3 runs


