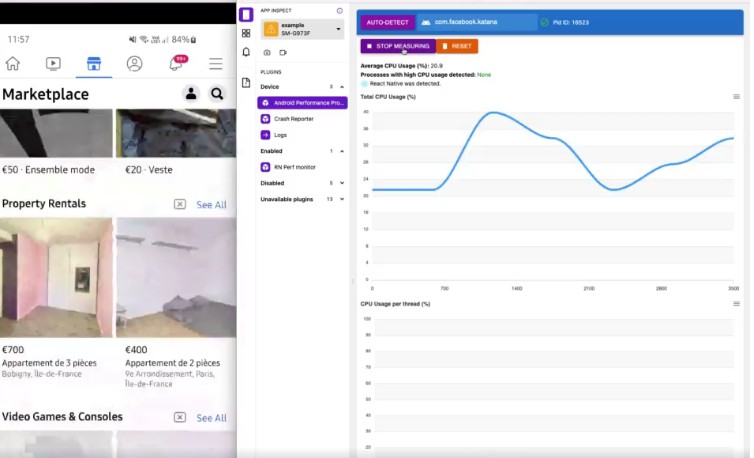
Android Performance Profiler
Measure the performance of any Android app, even in production, via a Flipper plugin or directly via CLI.
prod-profiler.mp4
Table of Contents
Getting started with the automated profiler
- Install the profiler
yarn add --dev @perf-profiler/e2e
- Write a test
For instance, here we’ll be testing the start up performance of the app for 10 iterations:
import { execSync } from "child_process";
import { TestCase, PerformanceTester } from "@perf-profiler/e2e";

const bundleId = "com.reactnativefeed";
const appActivity = `${bundleId}.MainActivity`;

const stopApp = () => execSync(`adb shell am force-stop ${bundleId}`);
const startApp = () =>
  execSync(`adb shell am start ${bundleId}/${appActivity}`);

const startTestCase: TestCase = {
  duration: 15000,
  beforeTest: () => {
    stopApp();
  },
  run: () => {
    startApp();
  },
};

const test = async () => {
  const performanceTester = new PerformanceTester(bundleId);
  await performanceTester.iterate(startTestCase, 10);
  performanceTester.writeResults();
};

test();
- Open the JSON file generated in the web profiler:
yarn add --dev @perf-profiler/web-reporter
yarn generate results.json
Flipper Plugin
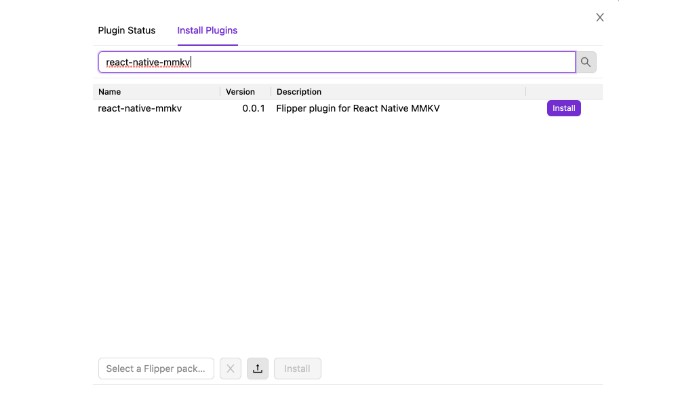
Install
Search for android-performance-profiler in the Flipper marketplace
CLI
Multiple commands are also available in the standalone package android-performance-profiler.
⚠️ they will be subject to breaking changes
For instance:
import {
  detectCurrentAppBundleId,
  getAverageCpuUsage,
  getPidId,
  Measure,
  pollPerformanceMeasures,
} from "@perf-profiler/profiler";

const bundleId = detectCurrentAppBundleId();
const pid = getPidId(bundleId);

const measures: Measure[] = [];

const polling = pollPerformanceMeasures(pid, (measure) => {
  measures.push(measure);
  console.log(`JS Thread CPU Usage: ${measure.perName["(mqt_js)"]}%`);
});

setTimeout(() => {
  polling.stop();
  const averageCpuUsage = getAverageCpuUsage(measures);
  console.log(`Average CPU Usage: ${averageCpuUsage}%`);
}, 10000);
Contributing
web-reporter
At the root of the repo:
yarn
yarn tsc --build --w
and run in another terminal:
yarn workspace @perf-profiler/web-reporter start
Then in packages/web-reporter/src/App.tsx, uncomment the lines to add your own measures:
// Uncomment with when locally testing
// eslint-disable-next-line @typescript-eslint/no-var-requires
testCaseResults = [
  require("../measures.json"),
];
You should now be able to open the local server
Run yarn jest Plugin -u after modifications.