React Native Performance Monitor
This project lets you see a realtime graph of render times within your React Native app. The purpose is for you to be able to create experiments (i.e. change markup and see how it affects render times).
Installation
npm i react-native-performance-monitor --save
npx react-native-performance-monitor get
Usage
import withPerformanceMonitor from 'react-native-performance-monitor/provider';
export default withPerformanceMonitor(YourScreen, 'Screen Name');
An example
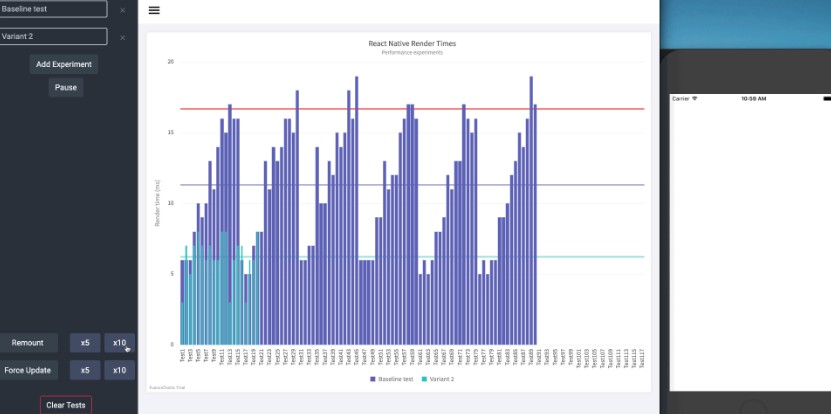
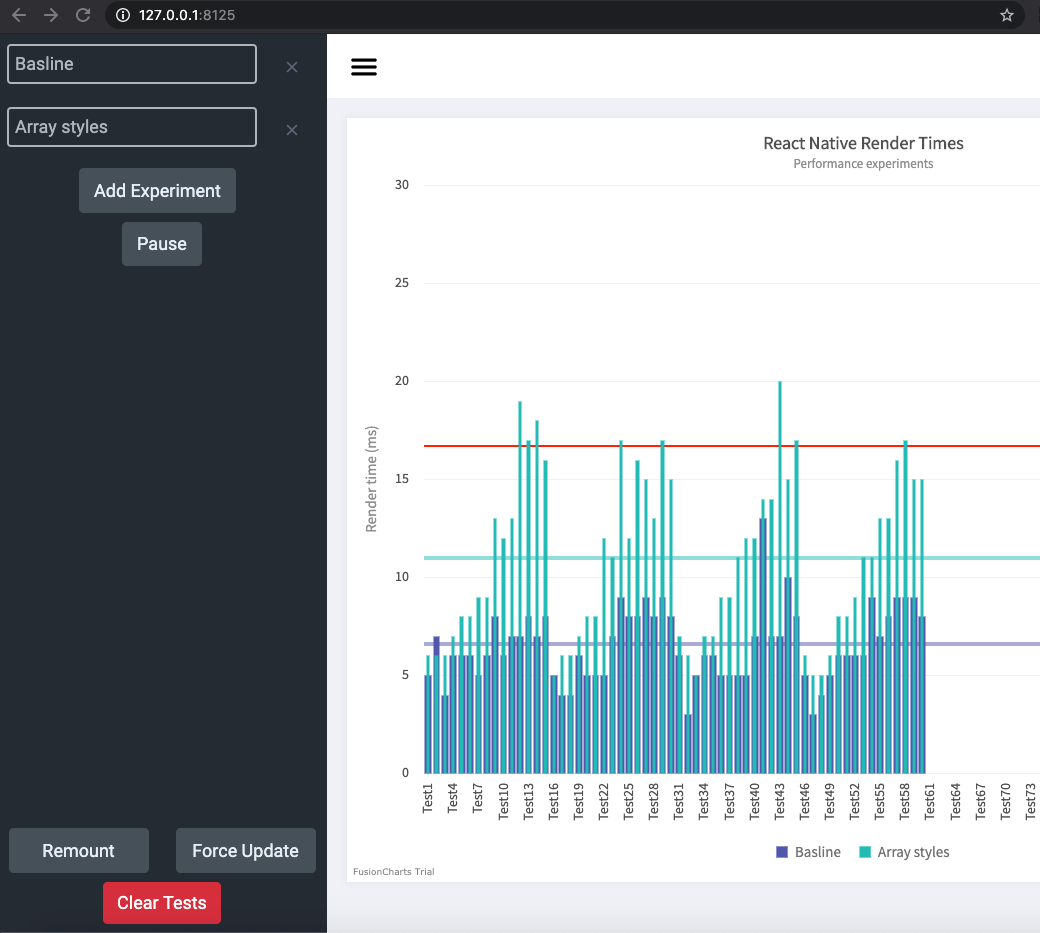
Set your baseline at http://127.0.0.1:8125/ by clicking remount. Pause the recorder, and adjust your component with what you think will improve performance.
Here's a before and after with this approach
Baseline
<Text style={[this.props.style]}>
    {this.props.children}
</Text>
Improved
<Text style={this.props.style}>
    {this.props.children}
</Text>
With this before and after I observed the following within a large flat list.
Connecting to a real device
In order to connect to a real device you will need to set the IP of your computer, for example:
export default withPerformanceMonitor(AwesomeChat, 'AwesomeChat', '192.168.1.10');
By default the server is listening on port 8125 for event updates and 8126 for websocket.
If you need to configure the port, because you are tunneling your request or similar, and or disable the Websocket communication, you can do it like this:
export default withPerformanceMonitor(AwesomeChat, 'AwesomeChat', '192.168.1.10', undefined, undefined, 80, false);
How it works
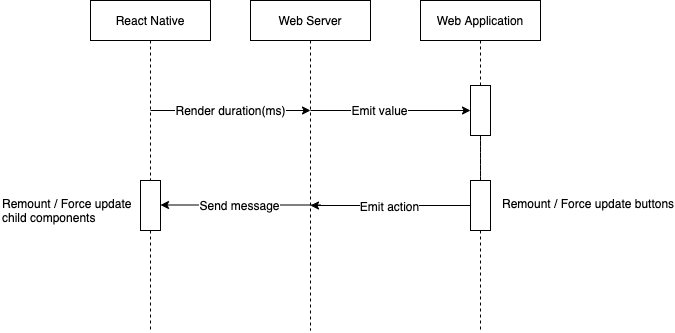
The overall implementation is quite straight forward and simply involved passing the onRenderCallback values via a websocket server to finally render them in a fancy graph.
There are 3 main components:
- A React Native component that sends profile data to a server via REST and listens to messages (remount and forceUpdate) to trigger renders.
- A Web socket server responsible for passing messages between the graph and the react native component
- A Web application that receives websocket values and renders them to a graph
The following diagram is a brief explanation of the data flow:
GitHub
https://github.com/Flagsmith/react-native-performance-monitor