react-native-gifted-charts
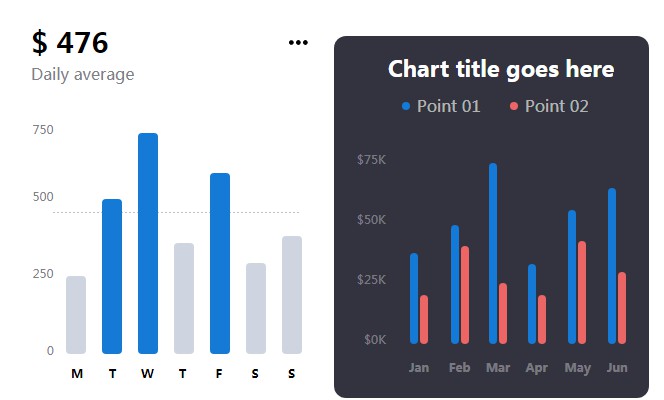
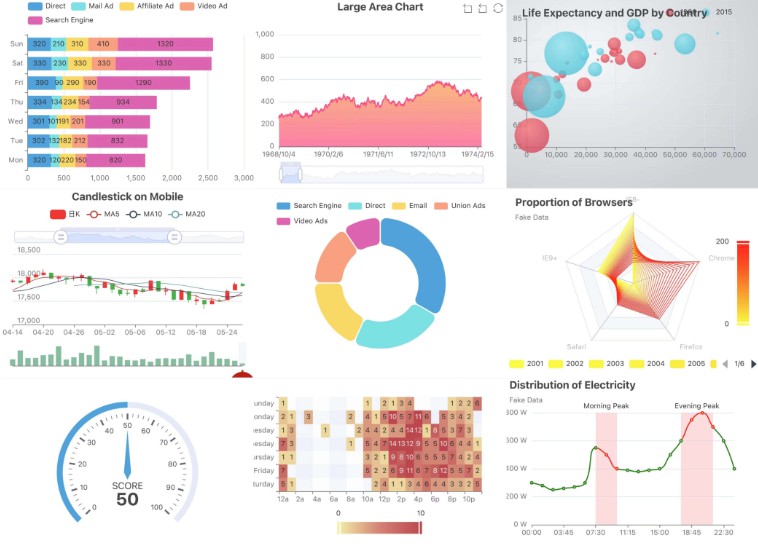
The most complete library for Bar, Line, Area, Pie, and Donut charts in React Native. Allows 2D, 3D, gradient, animations and live data updates.
Yet another chart library? Why?
To bring Life to your data
- Plenty of features with minimal code
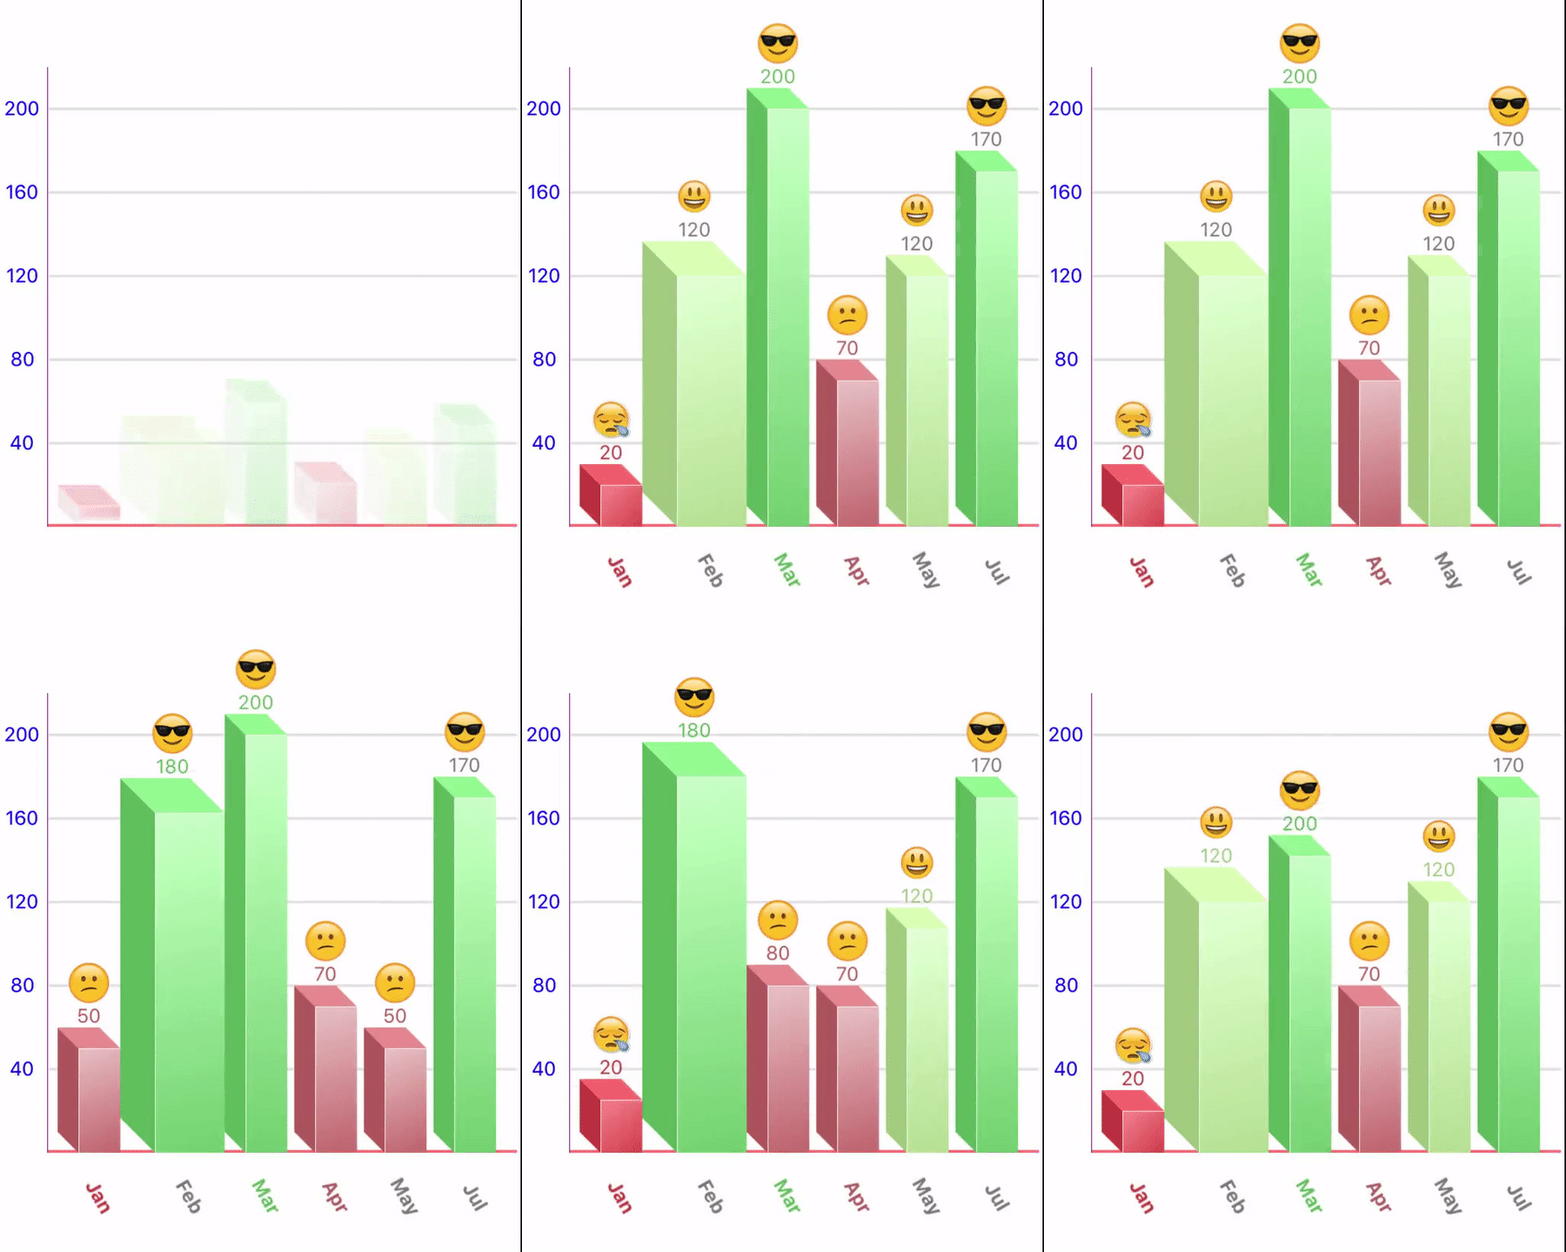
- Apply animations to your charts on load and on value change, just by adding a prop
- Smooth animations implemented using LayoutAnimation
- Clickable and scrollable
- Three-D and gradient effects
- Fully customizable
- Detailed documentation with examples

Installation
npm install react-native-gifted-charts react-native-linear-gradient react-native-svg
For Pie chart and Donut chart, these additional packages should be installed-
npm i react-native-canvas react-native-webview
You can omit the above packages if you don't intend to use Pie chart or Donuut chart.
For iOS-
cd ios && pod install
Docs
Usage
The simplest usage of various types of charts can be done as below-
import { BarChart, LineChart, PieChart } from "react-native-gifted-charts";

// ...
const data=[ {value:50}, {value:80}, {value:90}, {value:70} ]

<BarChart data = {data} />
<LineChart data = {data} />
<PieChart data = {data} />

// For Horizontal Bar chart, just add the prop horizontal to the <BarChart/> component

<BarChart data = {data} horizontal />

// For Area chart, just add the prop areaChart to the <LineChart/> component

<LineChart data = {data} areaChart />

// For Donut chart, just add the prop donut to the <PieChart/> component

<PieChart data = {data} donut />
GitHub
https://github.com/Abhinandan-Kushwaha/react-native-gifted-charts
