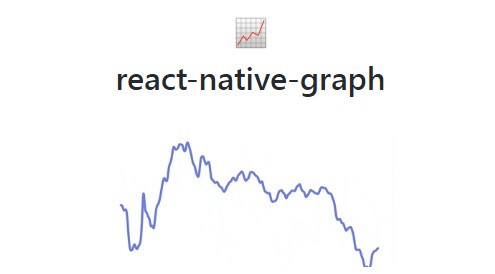

? react-native-graph

Beautiful, high-performance Graphs/Charts for React Native.
About
react-native-graph is a Line Graph implementation based on the high performance 2D graphics rendering engine “Skia”. It’s used in the Pink Panda Wallet app to power thousands of token graphs every day.
- ?️ Faster and smoother than react-native-svg graphs
- ⚡️ Native path interpolation in Skia
- ? Up to 120 FPS animations
- ? Cubic bezier rendering for smoother edges
- ? Smooth pan/scrubbing gesture
- ? Made for crypto apps and Wallets
- ❌ Does not block navigation, press or scroll animations
Installation
yarn add react-native-reanimated
yarn add react-native-gesture-handler
yarn add @shopify/react-native-skia
yarn add react-native-graph
Usage
function App() {
  const priceHistory = usePriceHistory('ethereum')

  return <LineGraph points={priceHistory} />
}
Configuration
animated

Whether to animate between data changes.
Animations are ran using the Skia animation system and are fully natively interpolated to ensure best possible performance.
If animated is false, a light-weight implementation of the graph renderer will be used, which is optimal for displaying a lot of graphs in large lists.
Example:
<LineGraph
  points={priceHistory}
  animated={true}
/>
enablePanGesture

Whether to enable the pan gesture.
Requires
animatedto betrue.
There are three events fired when the user interacts with the graph:
onGestureStart: Fired once the user presses and holds down on the graph. The pan gesture activates.onPointSelected: Fired for each point the user pans through. You can use this event to update labels or highlight selection in the graph.onGestureEnd: Fired once the user releases his finger and the pan gesture deactivates.
Example:
<LineGraph
  points={priceHistory}
  animated={true}
  enablePanGesture={true}
  onGestureStart={() => hapticFeedback('impactLight')}
  onPointSelected={(p) => updatePriceTitle(p)}
  onGestureEnd={() => resetPriceTitle()}
/>
TopAxisLabel / BottomAxisLabel

Used to render labels above or below the Graph.
Requires
animatedto betrue.
Usually this is used to render the maximum and minimum values of the Graph. You can get the maximum and minimum values from your graph points array, and smoothly animate the labels on the X axis accordingly.
Example:
<LineGraph
  points={priceHistory}
  animated={true}
  TopAxisLabel={() => <AxisLabel x={max.x} value={max.value} />}
  BottomAxisLabel={() => <AxisLabel x={min.x} value={min.value} />}
/>
selectionDotShadowColor

The color of the selection dot.
Requires
animatedandenablePanGestureto betrue.
Example:
<LineGraph
  points={priceHistory}
  animated={true}
  enablePanGesture={true}
  selectionDotShadowColor="#333333"
/>
Sponsor

react-native-graph is sponsored by Pink Panda.
Download the Pink Panda mobile app to see react-native-graph in action!
Adopting at scale
react-native-graph was built at Margelo, an elite app development agency. For enterprise support or other business inquiries, contact us at [email protected]!
Thanks
Special thanks to William Candillon and Christian Falch for their amazing help and support for React Native Skia ❤️