react-vis
A COMPOSABLE VISUALIZATION SYSTEM.
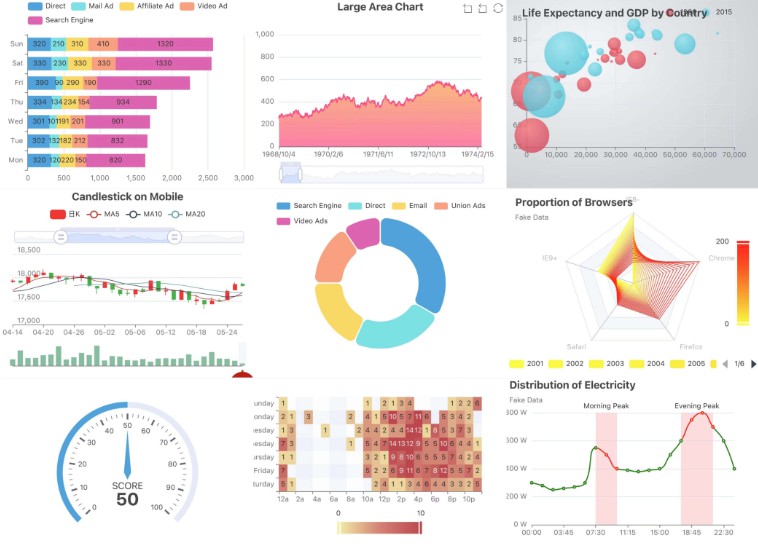
A collection of react components to render common data visualization charts, such as line/area/bar charts, heat maps, scatterplots, contour plots, pie and donut charts, sunbursts, radar charts, parallel coordinates, and tree maps.
Live Demo
http://uber.github.io/react-vis/examples/showcases/axes
Some notable features:
- Simplicity.
react-visdoesn't require any deep knowledge of data visualization libraries to start building your first visualizations. - Flexibility.
react-visprovides a set of basic building blocks for different charts. For instance, separate X and Y axis components. This provides a high level of control of chart layout for applications that need it. - Ease of use. The library provides a set of defaults which can be overridden by the custom user's settings.
- Integration with React.
react-vissupports the React's lifecycle and doesn't create unnecessary nodes.
Usage
Install react-vis via npm.
npm install react-vis --save
Include the built main CSS file in your HTML page or via SASS:
@import "./node_modules/react-vis/dist/style";
You can also select only the styles you want to use. This helps minimize the size of the outputted CSS. Here's an example of importing only the legends styles:
@import "./node_modules/react-vis/dist/styles/legends";
Import the necessary components from the library...
import {XYPlot, XAxis, YAxis, HorizontalGridLines, LineSeries} from 'react-vis';
… and add the following code to your render function:
<XYPlot
  width={300}
  height={300}>
  <HorizontalGridLines />
  <LineSeries
    data={[
      {x: 1, y: 10},
      {x: 2, y: 5},
      {x: 3, y: 15}
    ]}/>
  <XAxis />
  <YAxis />
</XYPlot>
If you're working in a non-node environment, you can also directly include the bundle and compiled style using basic html tags.
<link rel="stylesheet" href="https://unpkg.com/react-vis/dist/style.css">
<script type="text/javascript" src="https://unpkg.com/react-vis/dist/dist.min.js"></script>