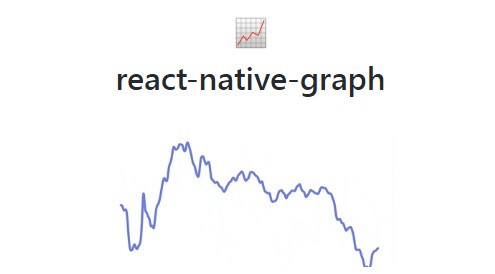
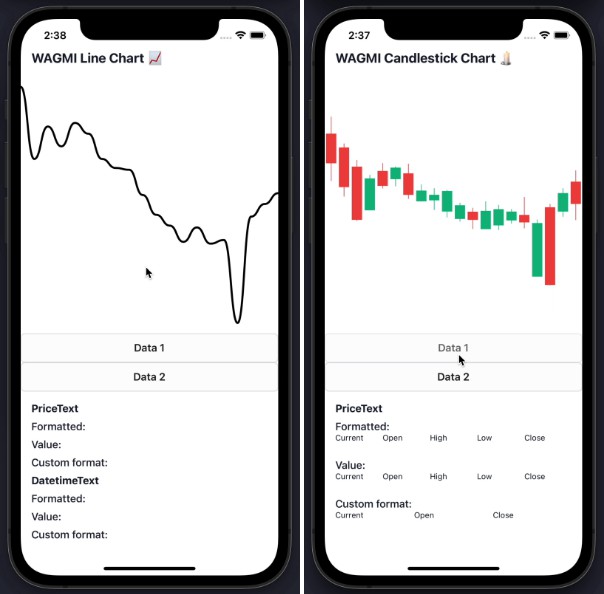
React Native Charts
A chart library for React Native. Currently there is support for vertical bar graphs, horizontal bar graphs, and line graphs, with support coming for scatter plots, pie charts, progress rings, and heat maps.
BaseChartConfig
-
startAtZero?: boolean -
hasXAxisLabels?: boolean -
hasYAxisLabels?: boolean -
xAxisLabelCount?: number (defaults to:4) -
xAxisLabelStyle?: {fontFamily?: stringfontSize?: numberfontWeight?: numbercolor?: stringrotation?: numberxOffset?: numberyOffset?: numberprefix?: stringsuffix?: string,position?: string (accepts:'left'or'right'. Defaults to:'left')width?: number,decimals?: number
}
-
yAxisLabelStyle?: {fontFamily?: stringfontSize?: numberfontWeight?: numbercolor?: stringrotation?: numberxOffset?: numberyOffset?: numberheight?: number
}
-
hasXAxisBackgroundLines?: boolean -
hasYAxisBackgroundLines?: boolean -
xAxisBackgroundLineStyle?: {strokeWidth?: numbercolor?: string
}
-
yAxisBackgroundLineStyle?: {strokeWidth?: numbercolor?: string
}
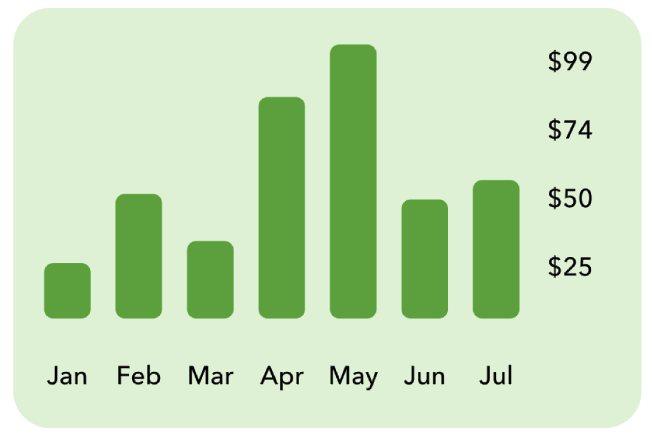
Vertical Bar Graph
Installation
npm i @chartiful/react-native-chart-builder @chartiful/react-native-vertical-bar-graph
Example
import VerticalBarGraph from '@chartiful/react-native-vertical-bar-graph'

<VerticalBarGraph
  data={[20, 45, 28, 80, 99, 43, 50]}
  labels={['Jan', 'Feb', 'Mar', 'Apr', 'May', 'Jun', 'Jul']}
  width={Dimensions.get('window').width - 90}
  height={200}
  barRadius={5}
  barWidthPercentage={0.65}
  barColor='#53ae31'
  baseConfig={{
    hasXAxisBackgroundLines: false,
    xAxisLabelStyle: {
      position: 'right',
      prefix: '$'
    }
  }}
  style={{
    marginBottom: 30,
    padding: 10,
    paddingTop: 20,
    borderRadius: 20,
    backgroundColor: `#dff4d7`,
    width: Dimensions.get('window').width - 70
  }}
/>
Interface
-
height: number -
width: number -
data:<Array>number -
labels?:<Array>string(defaults to[1, 2, 3, ...]) -
barRadius?: number (defaults to0) -
barWidthPercentage?: number (defaults to0.7) -
barColor?: string (defaults to#000000) -
style?:ReactNative.StyleSheet -
baseConfig?:BaseChartConfig(found here: link)
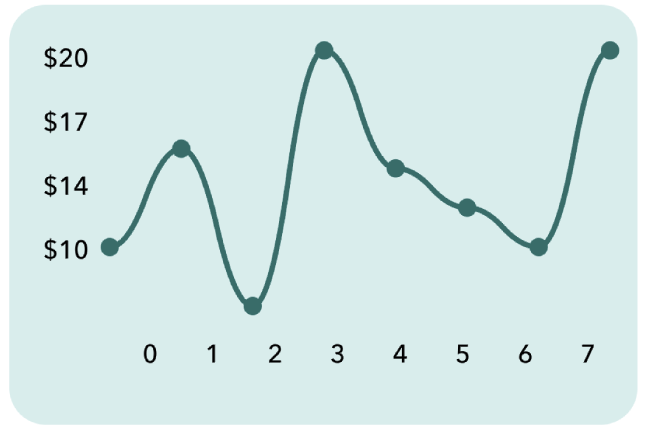
Line Graph
Installation
npm i @chartiful/react-native-chart-builder @chartiful/react-native-line-graph
Example
import LineGraph from '@chartiful/react-native-line-graph'

<LineGraph
  data={[10, 15, 7, 20, 14, 12, 10, 20]}
  width={Dimensions.get('window').width - 90}
  height={200}
  lineColor='#347975'
  dotColor='#347975'
  lineWidth={3}
  isBezier
  hasDots={true}
  baseConfig={{
    startAtZero: false,
    hasXAxisBackgroundLines: false,
    xAxisLabelStyle: {
      prefix: '$',
      offset: 0
    }
  }}
  style={{
    marginBottom: 30,
    padding: 10,
    paddingTop: 20,
    borderRadius: 20,
    width: Dimensions.get('window').width - 70,
    backgroundColor: `#dbf0ef`
  }}
/>
Interface
-
height: number -
width: number -
data:<Array>number -
labels?:<Array>string(defaults to[1, 2, 3, ...]) -
hasLine?: boolean (defaults totrue) -
lineColor?: string (defaults to'#000000') -
lineWidth?: number (defaults to3) -
hasDots?: boolean (defaulst totrue) -
dotColor?: string (defaults to'#000000') -
dotSize?: number (defaulse to5) -
isBezier?: boolean (defaults tofalse) -
hasShadow?: boolean (defaults tofalse) -
style?:ReactNative.StyleSheet -
baseConfig?:BaseChartConfig
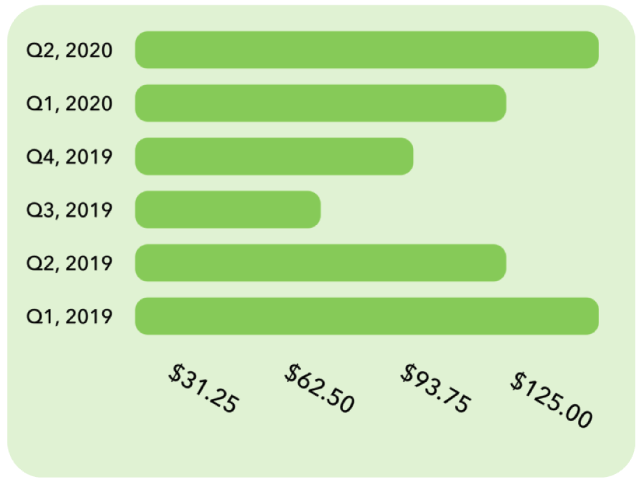
Horizontal Bar Graph
Installation
npm i @chartiful/react-native-chart-builder @chartiful/react-native-horizontal-bar-graph
Example
import HorizontalBarGraph from '@chartiful/react-native-horizontal-bar-graph'

<HorizontalBarGraph
  data={[125, 100, 50, 75, 100, 125]}
  labels={['Q1, 2019', 'Q2, 2019', 'Q3, 2019', 'Q4, 2019', 'Q1, 2020', 'Q2, 2020']}
  width={Dimensions.get('window').width - 100}
  height={225}
  barRadius={7}
  barColor='#82d551'
  baseConfig={{
    hasYAxisBackgroundLines: false,
    xAxisLabelStyle: {
      rotation: 0,
      fontSize: 11,
      width: 60,
      yOffset: 4,
      xOffset: -12
    },
    yAxisLabelStyle: {
      rotation: 30,
      fontSize: 13,
      prefix: '$',
      position: 'bottom',
      xOffset: 15,
      yOffset: -10,
      decimals: 2,
      height: 50
    }
  }}
  style={{
    marginBottom: 30,
    padding: 10,
    paddingTop: 20,
    borderRadius: 20,
    width: Dimensions.get('window').width - 155,
    backgroundColor: `#e1f5d6`
  }}
/>
Interface
-
height: number -
width: number -
data:<Array>number -
labels?:<Array>string(defaults to[1, 2, 3, ...]) -
barRadius?: number (defaults to0) -
barWidthPercentage?: number (defaults to0.7) -
barColor?: string (defaults to#000000) -
style?:ReactNative.StyleSheet -
baseConfig?:BaseChartConfig(found here: link)