react-native-echarts-wrapper
ECharts wrapper build for React Native.
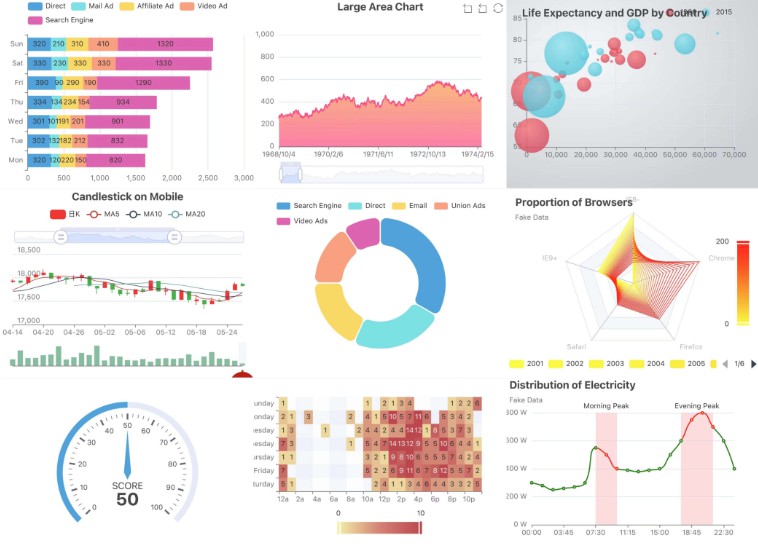
A React Native wrapper for the popular echarts charting framework. With this library you can create complex, interactive charts with great performance on mobile devices.
The fact that the charting framework purely runs in a webview makes it very stable to upcomming React-Native versions. On the other hand it is not easy to make a two way data communication between the chart (running in the webview Javascript thread) and the React-Native Javascript thread. With this library you can even build the more complex chart options of echarts. You can inject custom javascript code within the webview which allows you to access the chart api (detect taps, selections etc...)
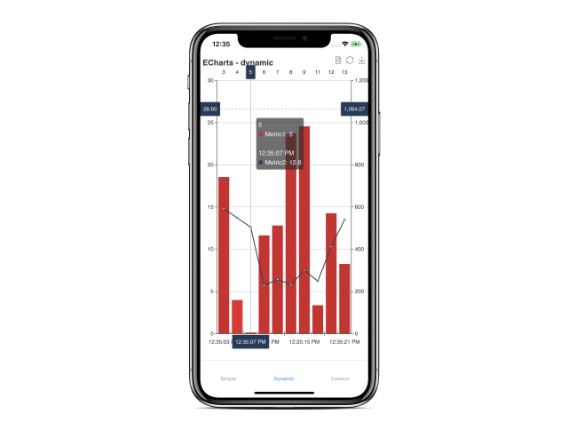
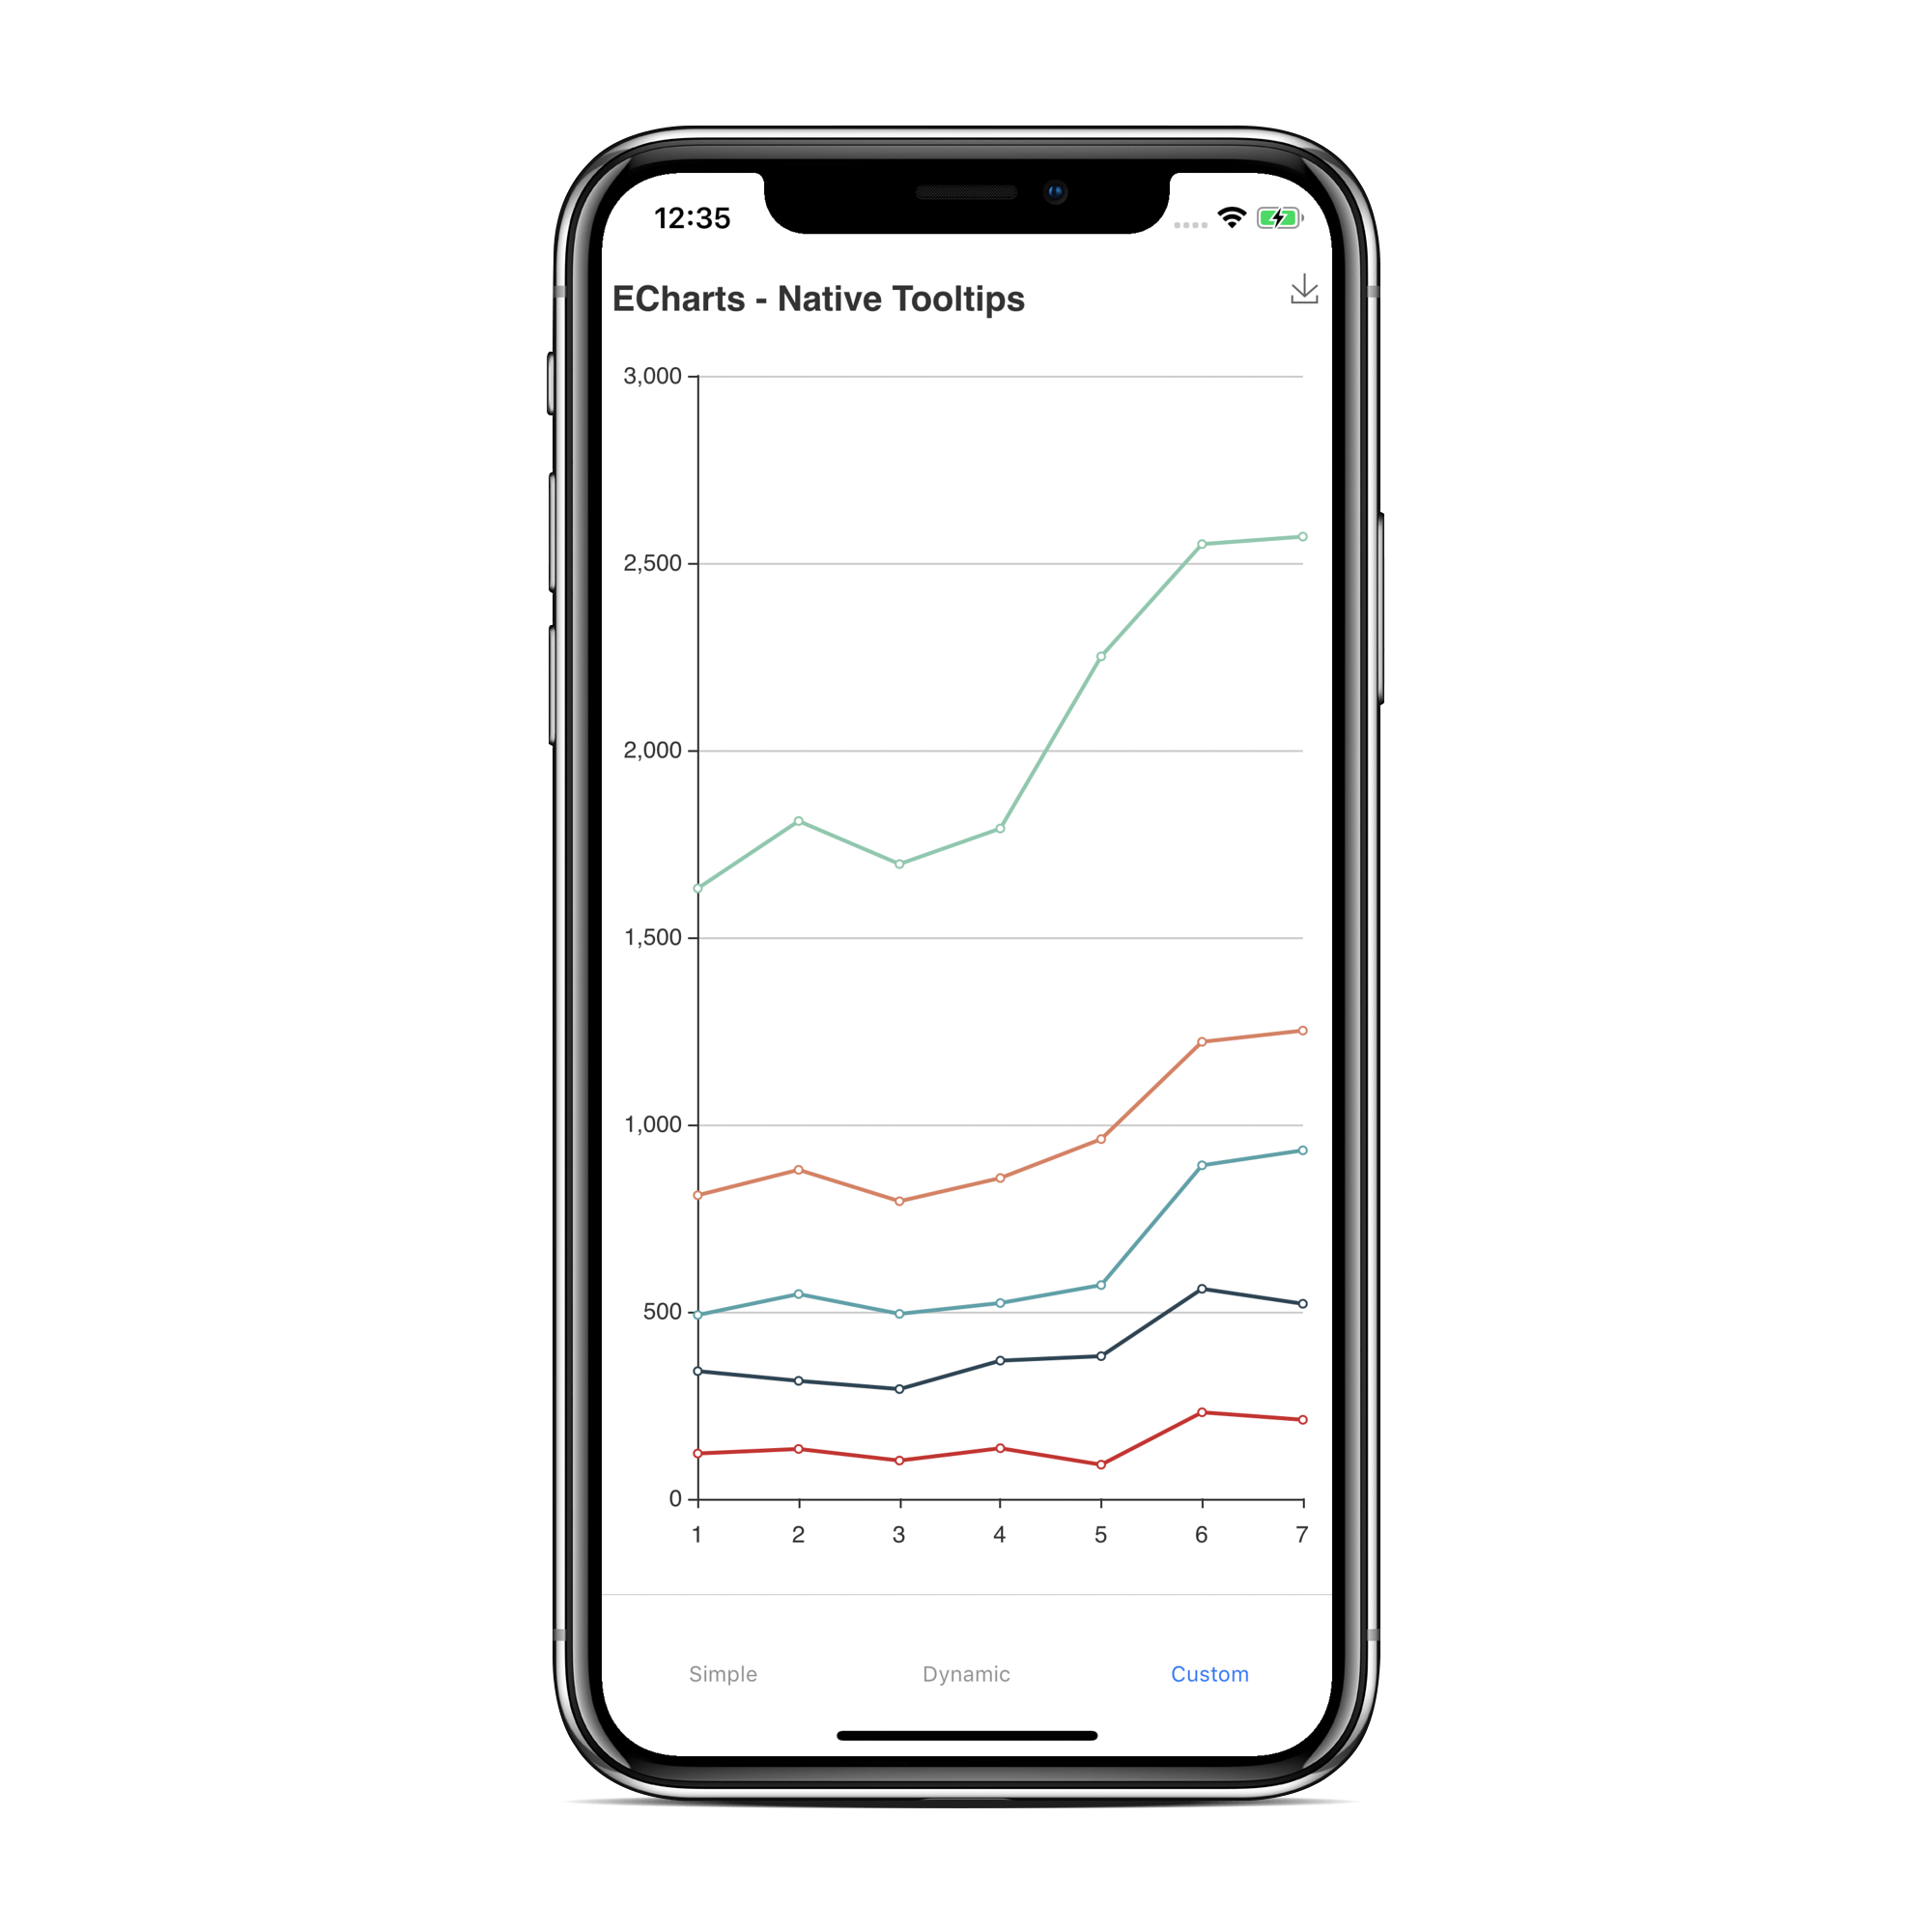
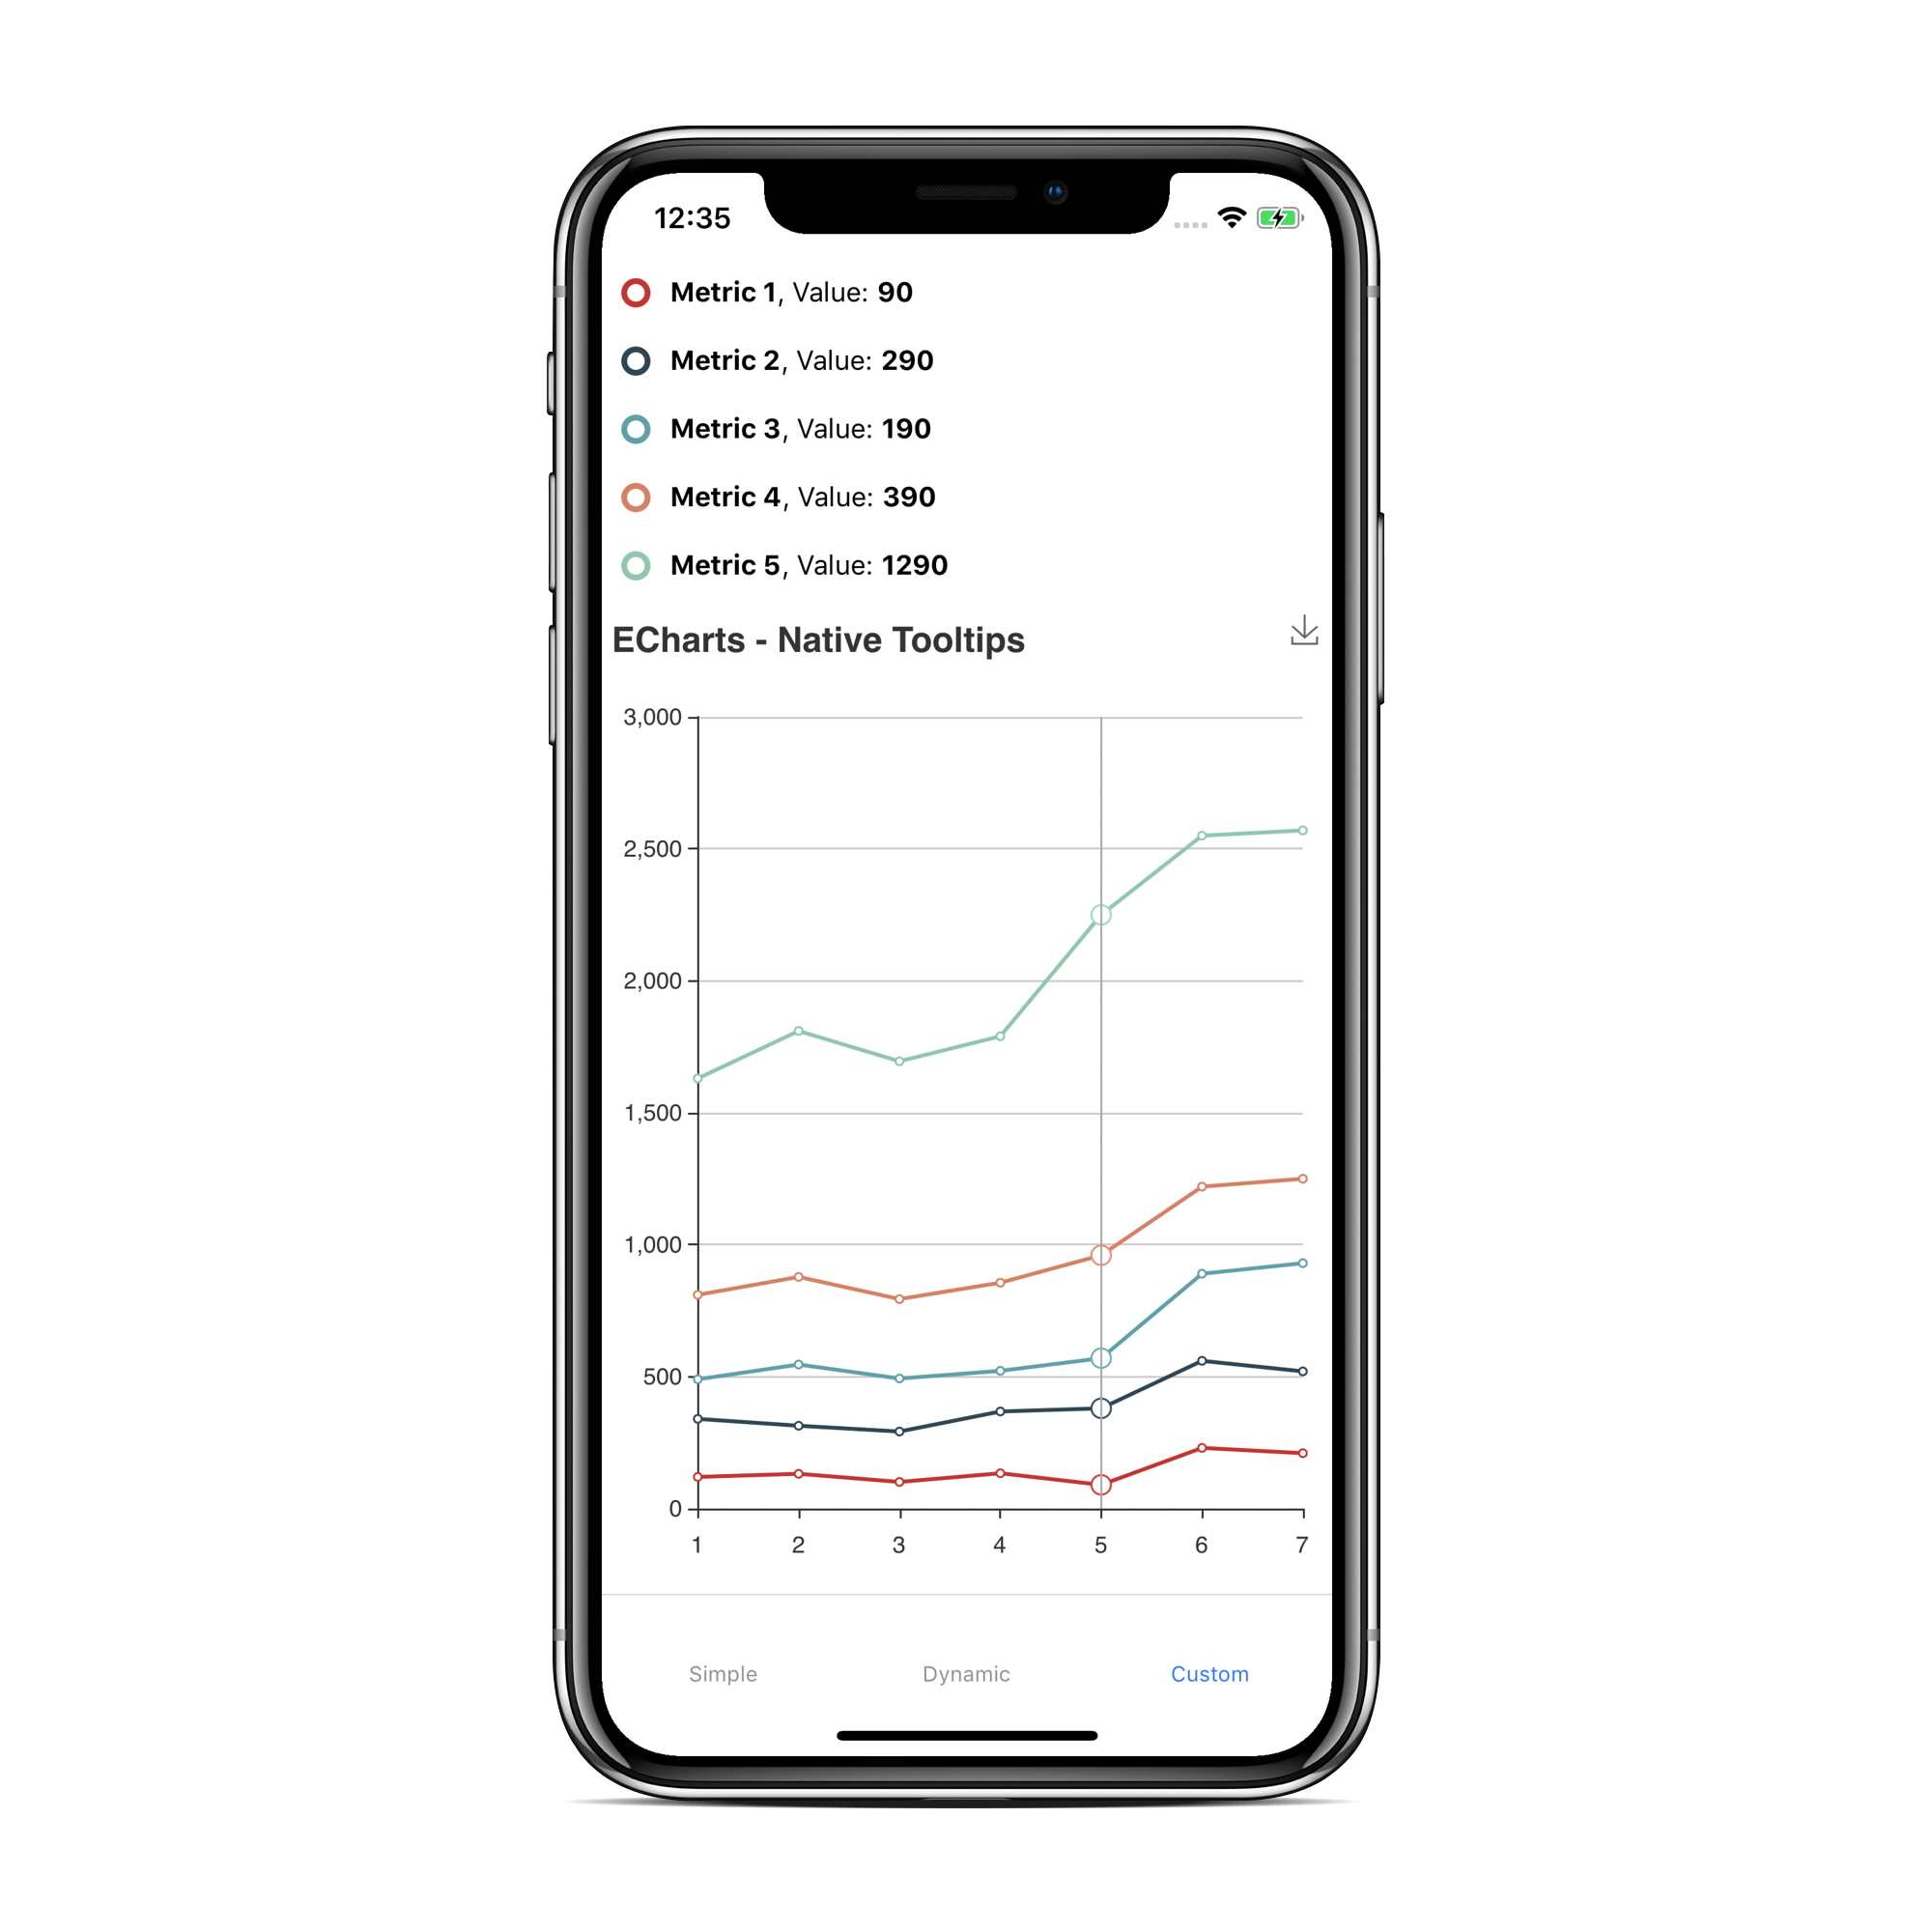
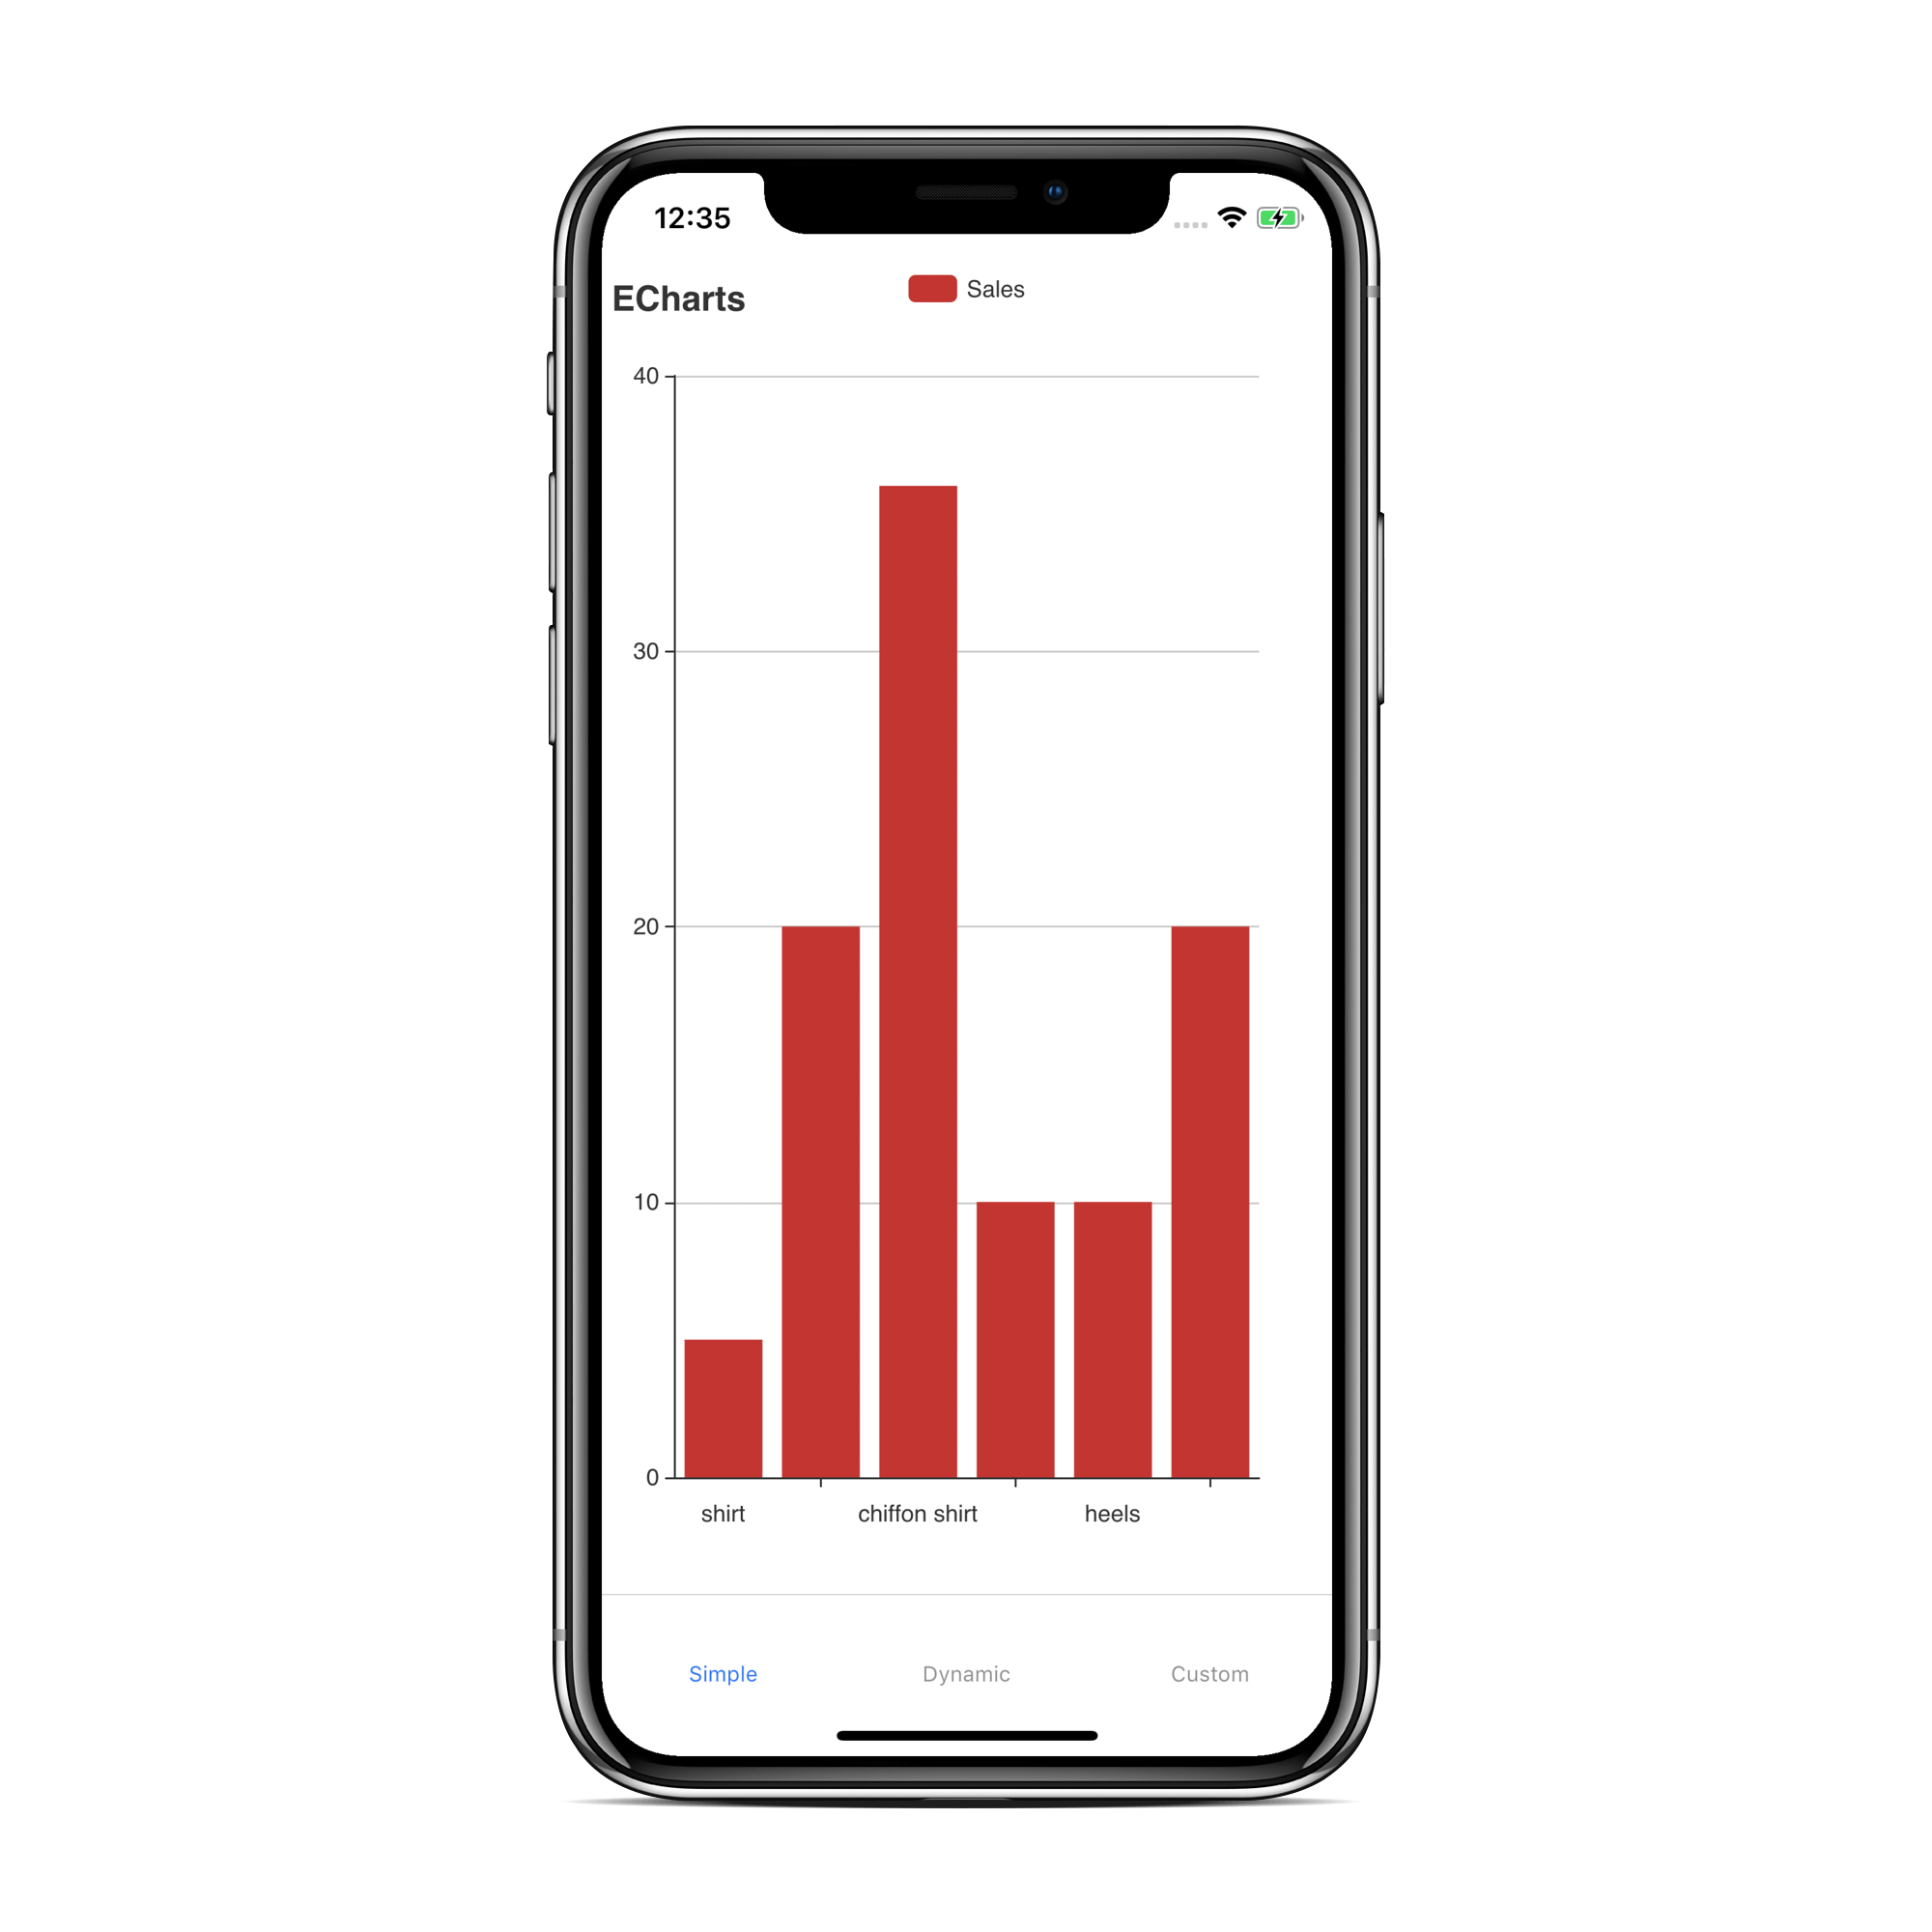
Screenshots
How To Use
$ npm install react-native-echarts-wrapper --save
Properties
| Name | Type | Example | Description |
|---|---|---|---|
| option | object | take a look at the examples | Allows you to set the chart configuration (https://ecomfe.github.io/echarts-examples/public/index.html). Never access anything related to your React-Native Javascript code within the options object. It won't work! Take a look at onData and sendData |
| baseUrl | string | file:///android_assets | Use this property if you want to tell echarts where to look for local assets. You can use RNFS to get the directory path for Android/iOS. Take a look at More complex example |
| additionalCode | string | alert('hello world'); |
Allows you to inject javascript code in the webview. It is used to access the echarts api to create more complex charts (e.G. callback on chart tap). Take a look at More complex example |
Methods / Callbacks
| Name | Example | Description |
|---|---|---|
| setOption | this.chart.setOption(option); |
Allows you to set a chart configuration dyanmically (e.g. after initial setup with option prop). Take a look at Dynamic loading example |
| getOption | this.chart.getOption((data) => console.log(data)); |
Allows you to get the current option of a chart instance. First parameter is the result-callback. If you don't pass a second parameter the result-callback will be triggered with all option properties. Second parameter is an array of the e-charts-option-properties (e.g. ['dataZoom', 'series']) you want to get. Take a look at Dynamic loading example |
| clear | this.chart.clear(); |
Allows you to clear the chart. Take a look at More complex example |
| onData | <ECharts onData={this.onData} /> |
This is the only way to receive data from the chart. It is called with the data provided by sendData (Webview functions). |
Webview functions
These functions can be called from code injected with additionalCode or within the echarts option.
| Name | Example | Description |
|---|---|---|
| sendData | sendData('Hello World') |
With this function you can communicate with React Native. Attention you can only send strings over to React-Native. sendData('Hello World') will call onData on the React Native side. Take a look at More complex example |
Webview variables
| Name | Example | Description |
|---|---|---|
| chart | chart.on(....) |
Allows you to access the echarts api (https://ecomfe.github.io/echarts-doc/public/en/api.html#echartsInstance). Take a look at More complex example |
Simple example
import React, { Component } from 'react';
import { StyleSheet, View } from 'react-native';
import { ECharts } from 'react-native-echarts-wrapper';

export default class App extends Component {
    option = {
        xAxis: {
            type: 'category',
            data: ['Mon', 'Tue', 'Wed', 'Thu', 'Fri', 'Sat', 'Sun']
        },
        yAxis: {
            type: 'value'
        },
        series: [{
            data: [820, 932, 901, 934, 1290, 1330, 1320],
            type: 'line'
        }]
    };

    render() {
        return (
            <View style={styles.chartContainer}>
                <ECharts option={this.option}></ECharts>
            </View>
        );
    }
}

const styles = StyleSheet.create({
    chartContainer: {
        flex: 1,
    },
});
More complex example
import React, { Component } from 'react';
import { StyleSheet, SafeAreaView, Button } from 'react-native';
import { ECharts } from 'react-native-echarts-wrapper';

export default class App extends Component {
    option = {
        xAxis: {
            type: 'category',
            data: ['Mon', 'Tue', 'Wed', 'Thu', 'Fri', 'Sat', 'Sun']
        },
        yAxis: {
            type: 'value'
        },
        series: [{
            data: [820, 932, 901, 934, 1290, 1330, 1320],
            type: 'line'
        }]
    };

    additionalCode = `
        chart.on('click', function(param) {
            var obj = {
            type: 'event_clicked',
            data: param.data
            };

            sendData(JSON.stringify(obj));
        });
    `;

    onData = (param) => {
        const obj = JSON.parse(param);

        if (obj.type === 'event_clicked') {
            alert(`you tapped the chart series: ${obj.data}`);
        }
    }

    onRef = (ref) => {
        if (ref) {
            this.chart = ref;
        }
    };

    onButtonClearPressed = () => {
        this.chart.clear();
    }

    render() {
        return (
            <SafeAreaView style={styles.chartContainer}>
                <Button title="Clear" onPress={this.onButtonClearPressed}></Button>

                <ECharts
                    ref={this.onRef}
                    option={this.option}
                    additionalCode={this.additionalCode}
                    onData={this.onData} />
            </SafeAreaView>
        );
    }
}

const styles = StyleSheet.create({
    chartContainer: {
        flex: 1,
        backgroundColor: '#F5FCFF',
    },
});
Dynamic loading example
import React, { Component } from 'react';
import { StyleSheet, SafeAreaView, Button } from 'react-native';
import { ECharts } from 'react-native-echarts-wrapper';

export default class App extends Component {

    onRef = (ref) => {
        if (ref) {
            this.chart = ref;
        }
    };

    onData = (param) => { }

    initChart = () => {
        function randomData() {
            now = new Date(+now + oneDay);
            value = value + Math.random() * 21 - 10;
            return {
                name: now.toString(),
                value: [
                    [now.getFullYear(), now.getMonth() + 1, now.getDate()].join('/'),
                    Math.round(value)
                ]
            }
        }

        var data = [];
        var now = +new Date(1997, 9, 3);
        var oneDay = 24 * 3600 * 1000;
        var value = Math.random() * 1000;
        for (var i = 0; i < 1000; i++) {
            data.push(randomData());
        }

        option = {
            title: {
                text: 'Dynamic Chart'
            },
            tooltip: {
                trigger: 'axis',
                formatter: function (params) {
                    params = params[0];
                    var date = new Date(params.name);
                    return date.getDate() + '/' + (date.getMonth() + 1) + '/' + date.getFullYear() + ' : ' + params.value[1];
                },
                axisPointer: {
                    animation: false
                }
            },
            xAxis: {
                type: 'time',
                splitLine: {
                    show: false
                }
            },
            yAxis: {
                type: 'value',
                boundaryGap: [0, '100%'],
                splitLine: {
                    show: false
                }
            },
            series: [{
                type: 'line',
                showSymbol: false,
                hoverAnimation: false,
                data: data
            }]
        };

        this.chart.setOption(option);

        //no query parameter: whole option object
        this.chart.getOption((option) => { console.log(option)});

        //with query parameter
        this.chart.getOption((option) => { console.log(option)}, ['dataZoom', 'series']);

        const instance = this.chart;

        setInterval(function () {

            for (var i = 0; i < 5; i++) {
                data.shift();
                data.push(randomData());
            }

            instance.setOption({
                series: [{
                    data: data
                }]
            });
        }, 100);
    }

    render() {
        return (
            <SafeAreaView style={styles.chartContainer}>
                <Button title="Start" onPress={this.initChart}></Button>

                <ECharts
                    option={{}}
                    ref={this.onRef}
                    additionalCode={this.additionalCode}
                    onData={this.onData} />
            </SafeAreaView>
        );
    }
}

const styles = StyleSheet.create({
    chartContainer: {
        flex: 1,
        backgroundColor: '#F5FCFF',
    },
});